VISIA Complexion Analysis
< BackPatented comparison to norms analysis uses the world’s largest skin feature database
Measure surface and subsurface skin conditions. Visualize of conditions such as spider veins, hyperpigmentation, rosacea, and acne.
Quantitative Analysis & Visual Assessment:
– Reputable: The VISIA(TM) analysis database was developed and validated by the Procter & Gamble Company (P&G). P&G markets 250 brands to five billion consumers in 130 countries.
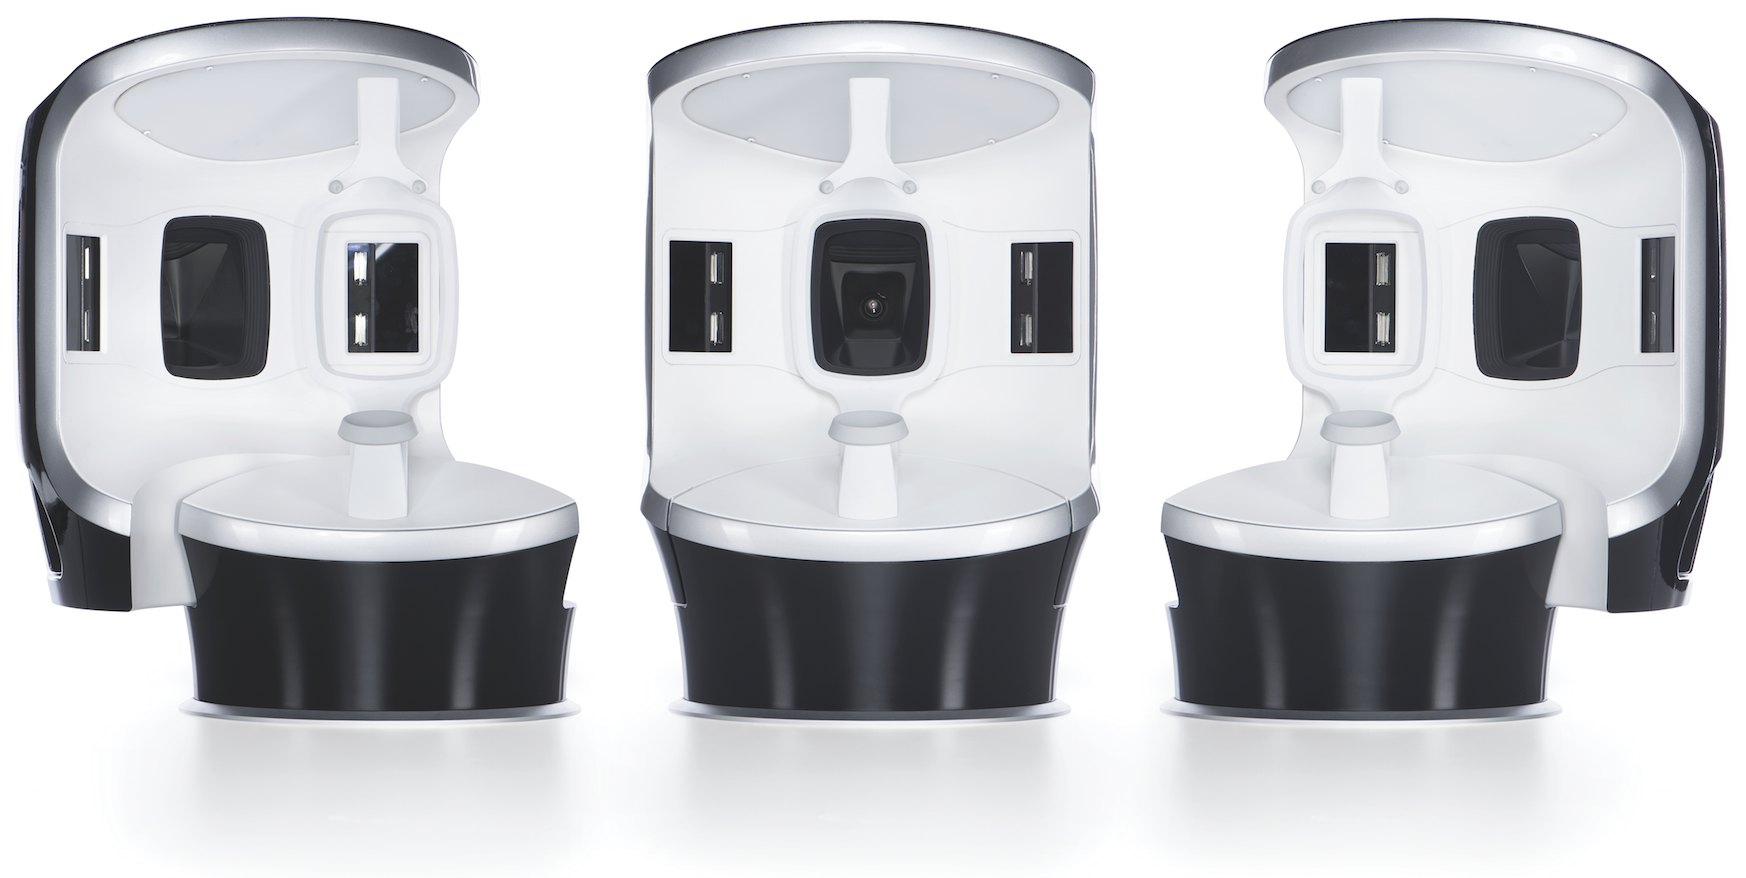
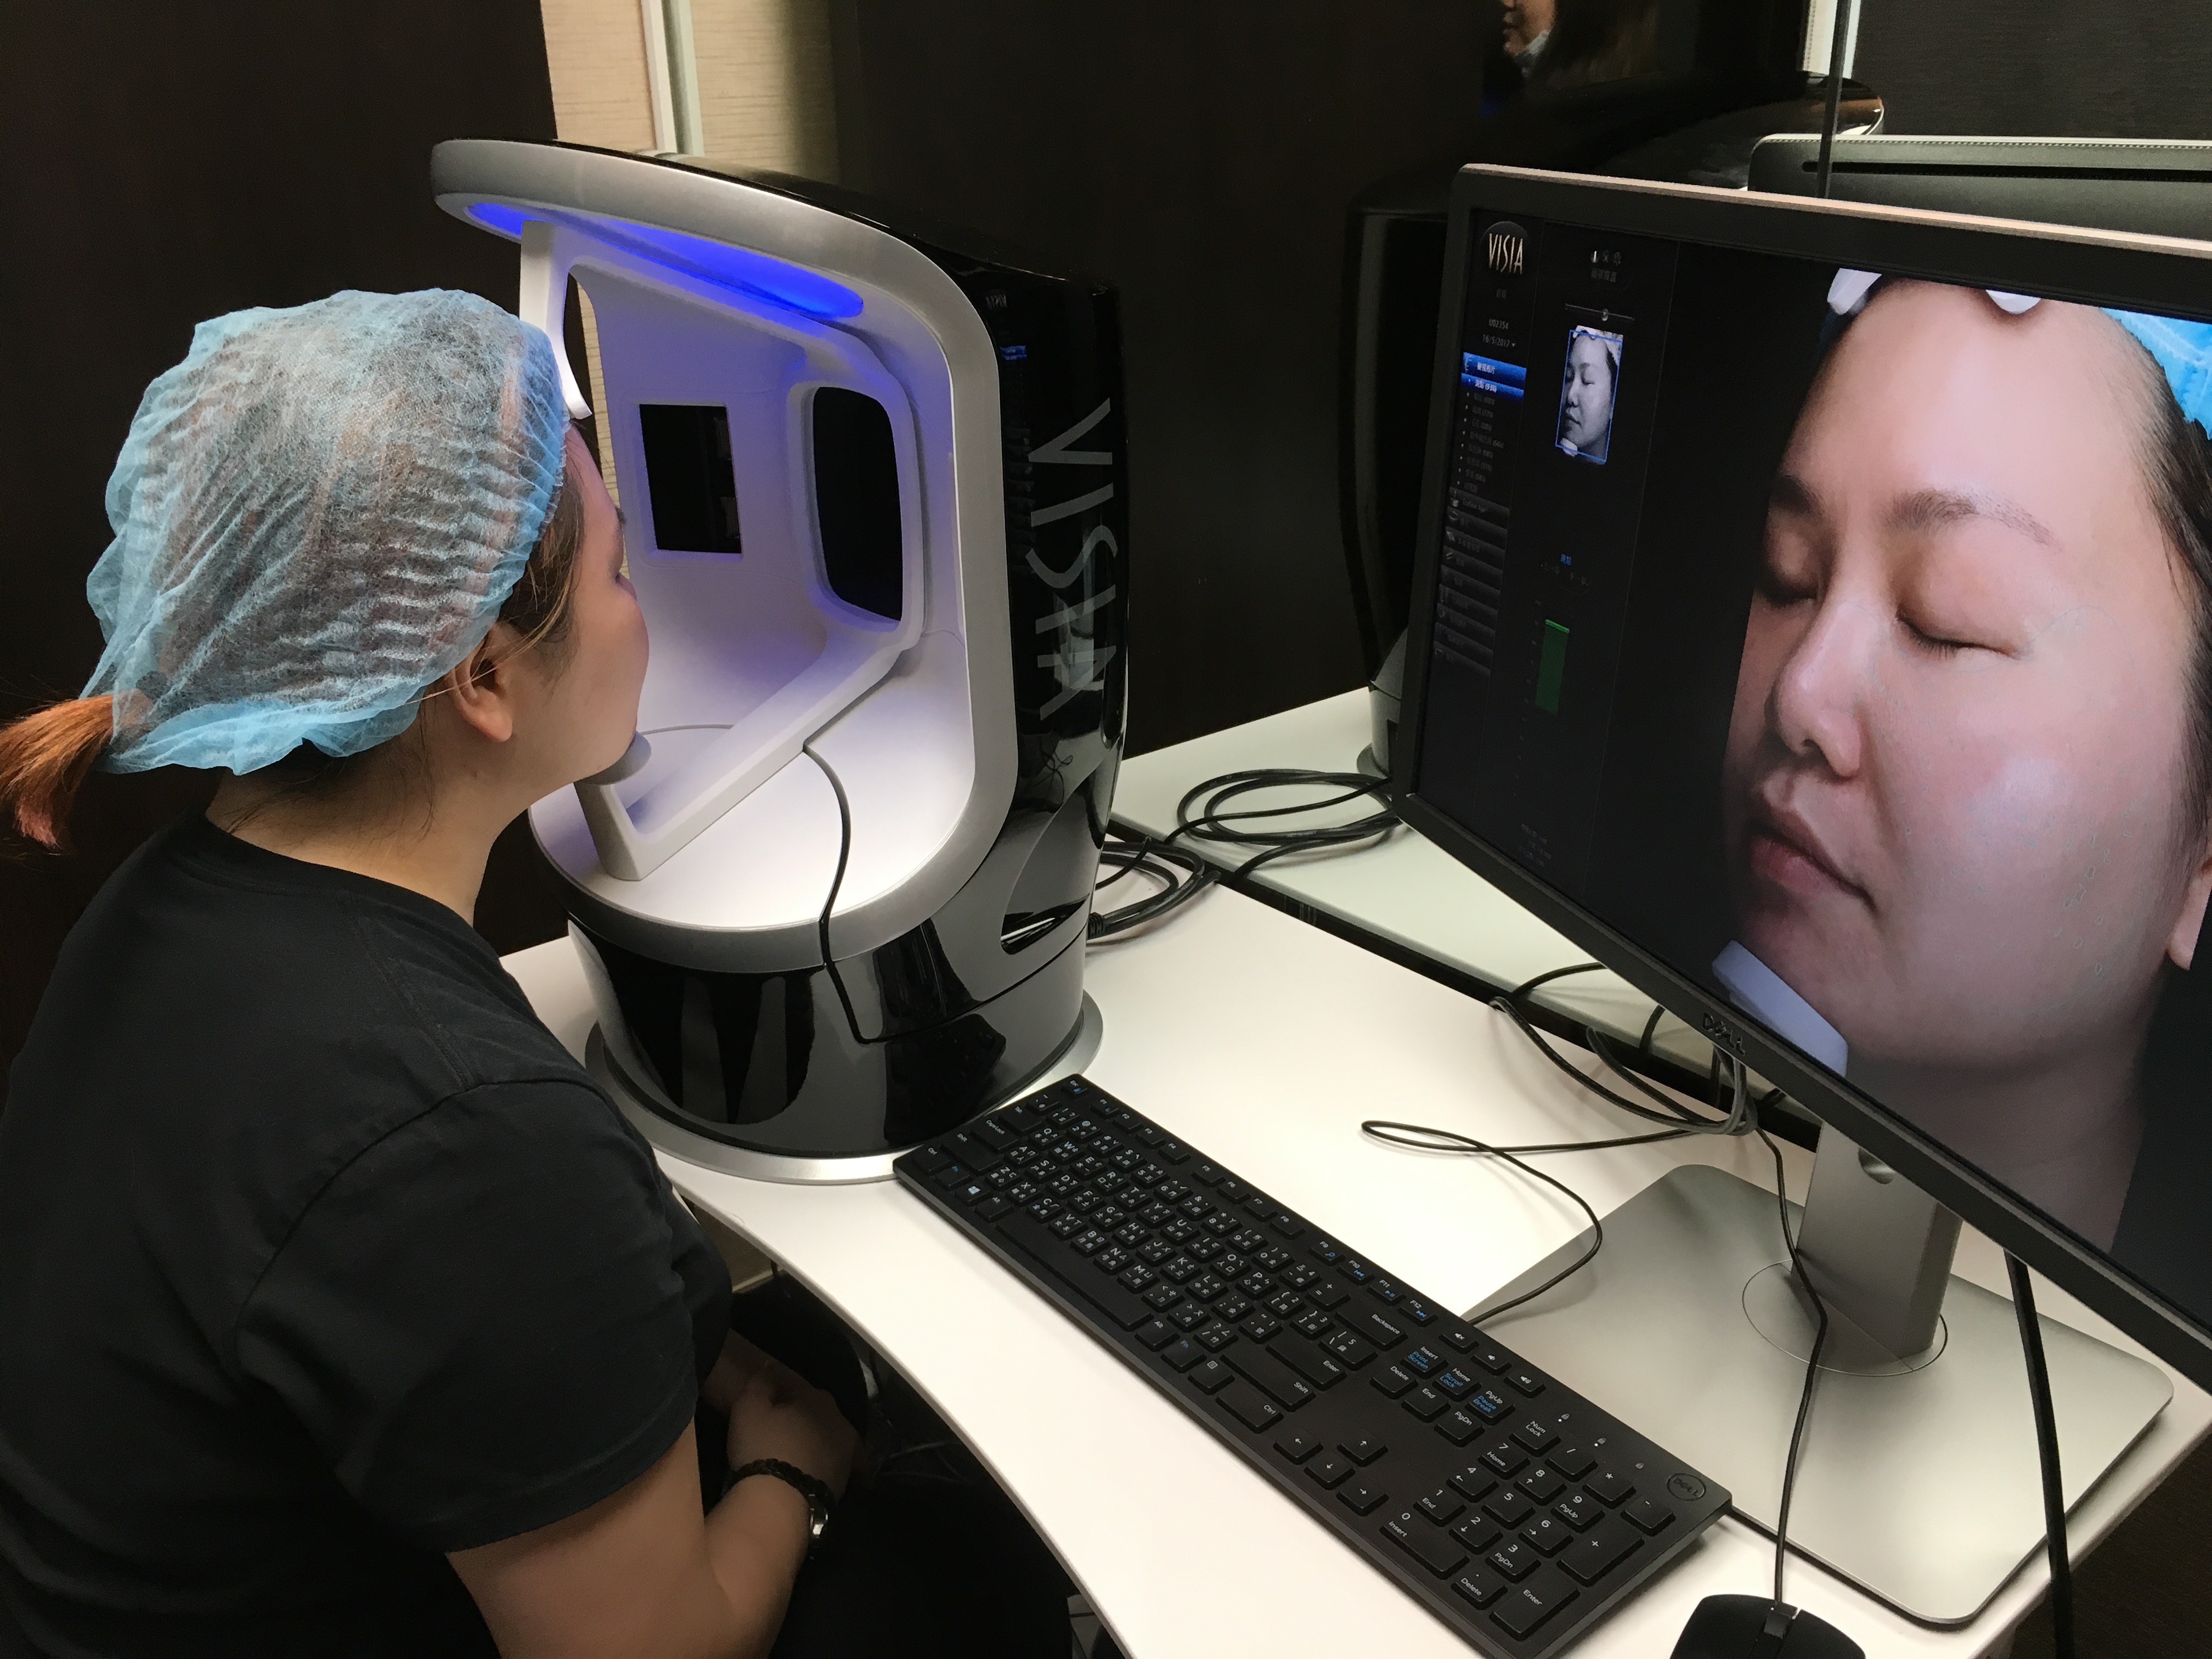
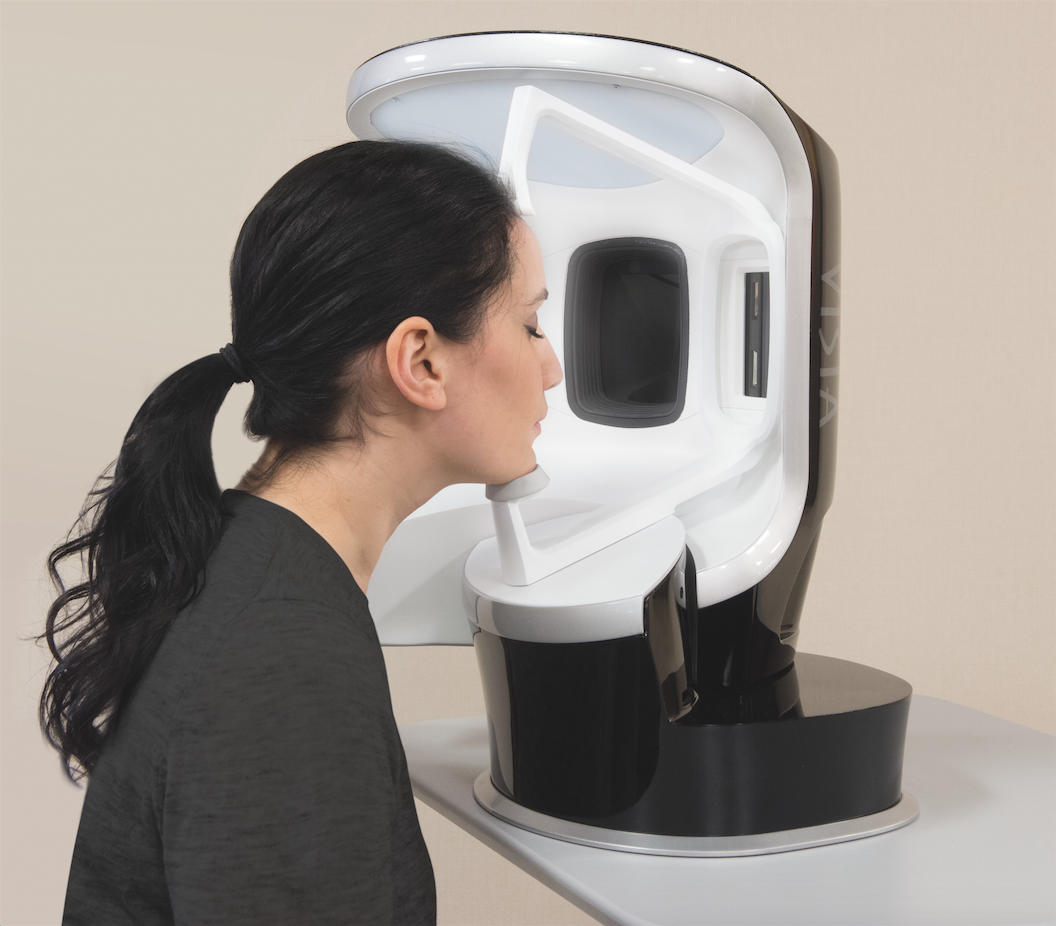
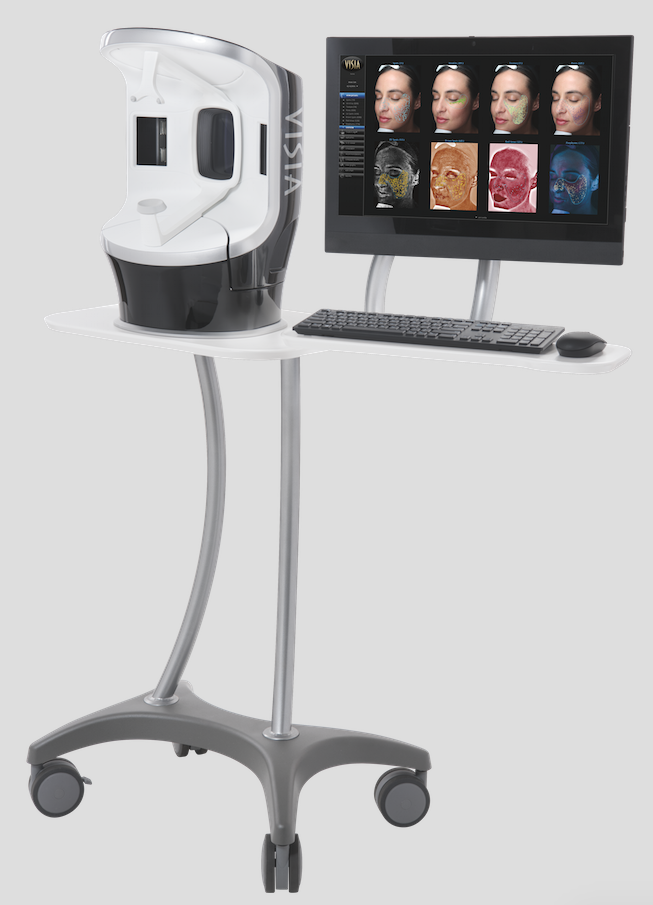
– Comfortable: A newly designed capture module rotates smoothly around the subject, greatly simplifying the imaging process while providing greater comfort for the client. Easily capture high quality, standardized facial images.
– Efficient:It literally takes only 5 minutes.
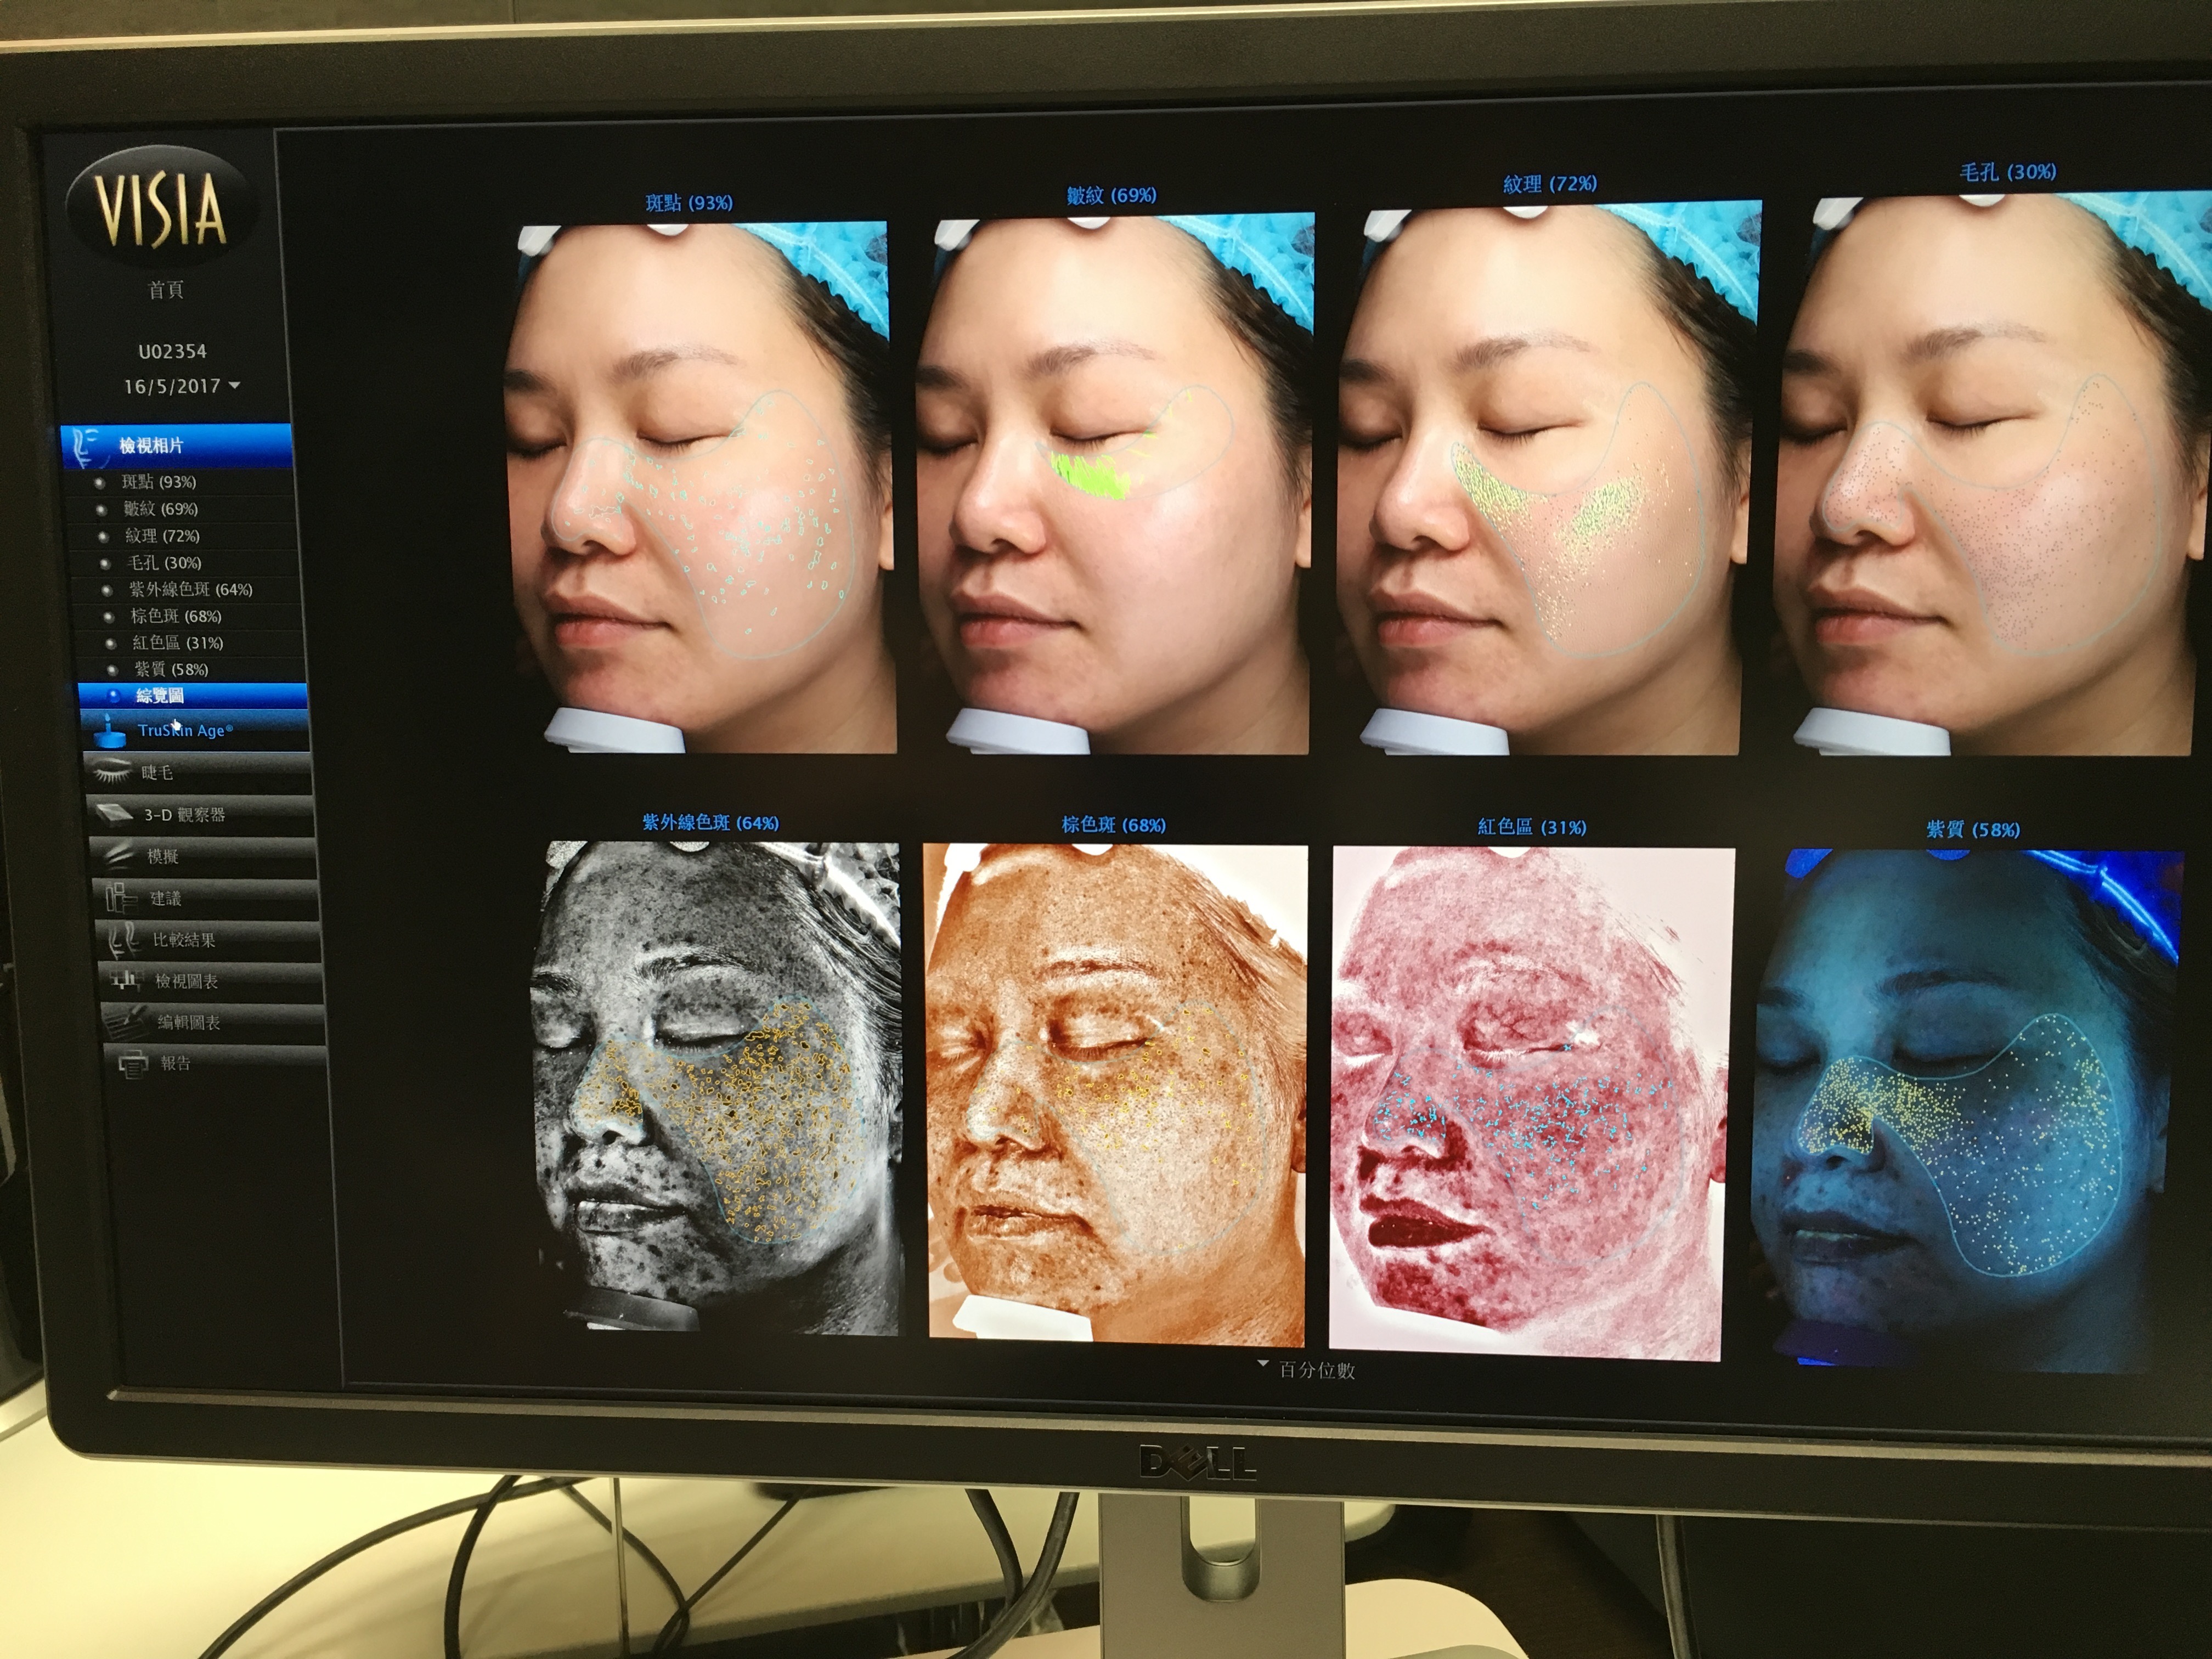
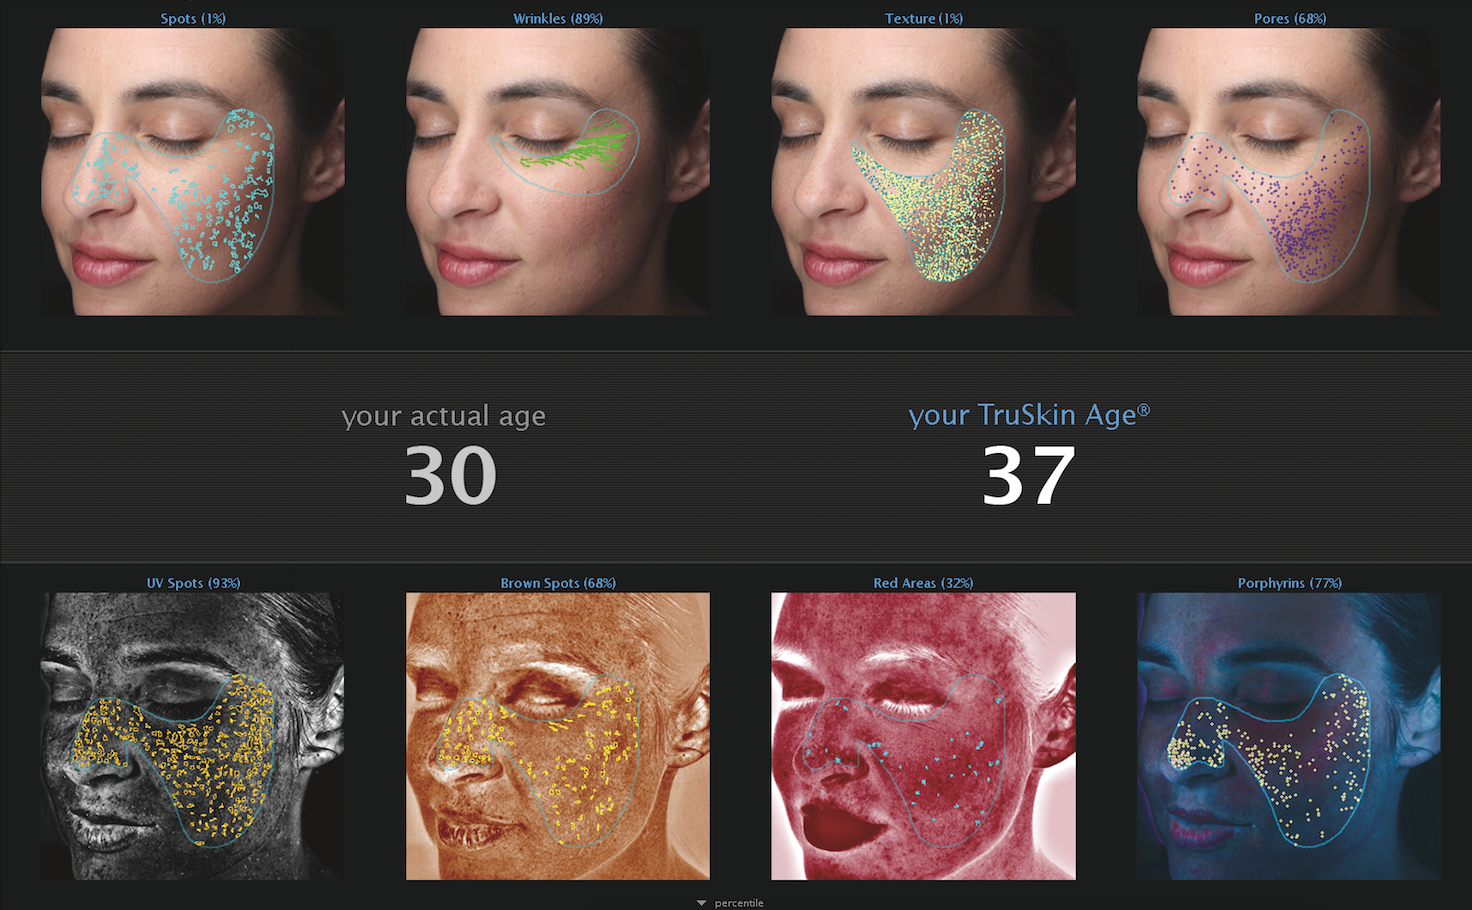
– Empirical:Grade your skin relative to others of the same age and skin type. Measure spots, wrinkles, texture, pores, UV spots, brown spots, red areas, and porphyrins.
– Analytical:Determines overall skin condition and age, providing a revolutionary new metric to guide the selection of skin care products and treatment options.
– Excellent Experience:Easily manage your expectations and track your improvements with treatments.
Features:
VISIA provides the most complete data set available for sun damage assessment and analysis, including UV fluorescence imaging to reveal porphyrins. Measure spots, wrinkles, texture, pores, UV spots, brown spots, red areas, and porphyrins. It simulate the aging process to show clients older or younger by 5-7 years for spots, wrinkles or both.
1. IntelliFlash®
Cross-polarized and UV lighting are used to record and measure surface and subsurface skin conditions. UV photography provides the most complete data set available for sun damage assessment and analysis, including UV fluorescence imaging to reveal porphyrins.
2. Multi-point positioning system and live image overlay
Make it easy to capture perfectly registered images to document progress over time. Rotating capture module easily captures left, right and frontal facial views.
3. Canfield’s RBX® Technology
Separates the unique color signatures of Red and Brown skin components for unequaled visualization of conditions such as spider veins, hyperpigmentation, rosacea, and acne.
4. Meaningful Comparisons
Compare results side by side for any combination of views, features or time points, including graphs and numerical data. Zoom and pan images in tandem for clear and easy comparisons.
5. Eyelash Analysis
Evaluates the results of lash improvement treatments with numerical assessments and graphic visualizations.
6. 3D VIEWER
Visualize the skin’s surface in three dimensions from any angle, rendered in natural skin tone, color relief, or gray scale.